It is well known that while in some ways humans have remarkable statistical intuition, we are also susceptible to blind spots which can lead to serious errors. One way to reduce the danger posed by these biases is to run some simulations. This allows us to get a feel for a likely answer, which can then be checked against our calculated probabilities. If we see good agreement, then it is likely we have calculated correctly. If not then we can re-examine our logic (and possibly our simulation) to get a grasp of where we have gone wrong. This article gives an example of checking statistical intuition with simulation.

A test which confirms intuition
Lets try this with a concrete example. Suppose we roll a normal six sided dice until we roll a six and count how long each sequence of rolls is. What would we expect the average number of rolls in each sequence to be?
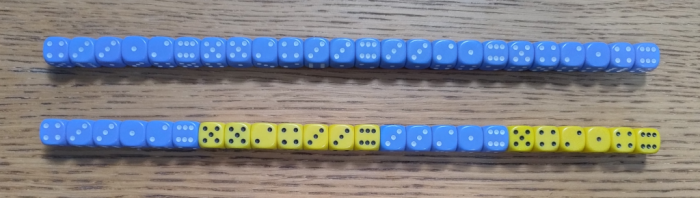
Well with a probability of 1/6 of rolling a six we might expect that the average length of sequences to be 1/(1/6) = 6. A visual illustration of such sequences might look like the second row of dice. Here the sequences ending in a six are coloured alternately blue and yellow:
If we want to check our calculation we could roll a lot of dice and calculate average sequence length. More easily, we can run a test with a small python program like this:
import random

sequences = []
# lets create 1000 test sequences
for i in range (1000):
    sequence = []
    # add values to a sequence until we roll a six
    while True:
        value = random.randint(1,6)
        sequence.append(value)
        if value == 6:
            # record the length of the finished sequence if we roll a 6
            sequences.append(len(sequence))
            break
# calculate the average length of our sequences
print(sum(sequences)/len(sequences))
Running this a few times we might get results like 5.991, 6.062, 6.106. This seems to give good support for our intuition and our mathematical justification that the average sequence length is 6.
A test which contradicts intuition
Now lets consider a modified form of the above question. This time we are still going to roll the dice until we get a 6 and count the rolls. However if we roll an odd number we will end the current sequence and roll again starting a new sequence. How long might we expect as the average sequence length now?
Naively this question appears simple. We are not allowing rolls of 1,3 or 5 so we only have 3 possible rolls 2,4 and 6, therefore we might jump to the conclusion that with a 1/3 chance of rolling a six we now expect a sequence length of 1/(1/3) or 3.
Fortunately we can check our answer by running a simulation. We might use code like:
import random

terminated = False
sequences = []
# lets create 1000 test sequences
for i in range (1000):
    sequence = []
    while True:
        value = random.randint(1,6)
        # terminate any sequence where we roll an odd number
        if value == 1 or value == 3 or value == 5:
            break
        # otherwise add values to a sequence until we roll a six
        else:
            sequence.append(value)
        if value == 6:
            # record the length of the finished sequence if we roll a 6
            sequences.append(len(sequence))
            break
if len(sequences) > 0:
    # calculate the average length of our sequences
    print(sum(sequences)/len(sequences))
When we run this code a few times though, we get an unexpected result. The average path lengths from our code are: 1.557, 1.539, 1.465. This is half our expected value of 3, so clearly something is wrong with either our code or our intuition, the simulation has alerted us that something unexpected is occurring. In this case it is the code which is correct and our intuition which is wrong.
Investigating the error
To understand why we might want to take a look at how many valid sequences our code produced by adding a line to the end of the code
print(len(sequences))
Running this we get numbers like 242, 267 and 253. It appears that only about 1/4 of our 1000 attempts to produce a sequence ending in six are successful. As an aside, this is why I checked that len(sequences) > 0. There is a theoretical possibility that our thousand attempts might produce no valid sequences though the probability is infinitesimal.
So what is actually happening? Well our sequences now terminate if we roll a 1,3,5 or 6. However we only retain the sequences ending in 6 (on average a quarter of the sequences). However that means that the chance of a sequence terminating is not 1/3 as we believed but actually 4/6. Therefore the expected length of a sequence should actually be 1/(4/6) or 6/4 which is 1.5 as confirmed by our simulation. Even though we throw away 3/4 of the sequences because they end in an odd number, that does not change the average expected length.
To see this visually consider the same sequence of dice rolls we had above but this time visualised according to our new rule. In this case we only consider the sequences highlighted in white on the bottom row of dice. These white sequences are the ones where where a sequence ends in six. The other sequences in yellow and blue terminate in an odd number.
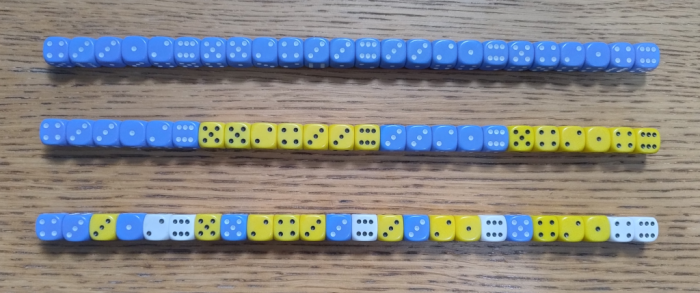
Seeing the pattern makes it clear why the expected length is 1.5 not 3. With both odds and sixes terminating sequences it is clear that sequences will tend to be short. This is a clear illustration of the power of simulation to check that experiment and prediction line up.
Conclusion
I hope this has been a useful toy example to demonstrate checking statistical intuition with simulation. With practice such simulations become quick to write and help to validate or invalidate our calculations. They can also offer insight into what is going on in a situation allowing us to make better predictions in future. Sometimes they can also indicate whether a Bayesian or Frequentist approach might be most useful for handling a situation
This is a cool way to check your gut feeling about stats! The dice rolling examples are super clear, and the Python code makes it easy to try out yourself. Good stuff, Justin!