We obtained accuracy scores for our LEGO recogniser, but what if we want to go further and look at our model’s errors in more detail? For this there are some useful tools available. These include confusion matrices and also Precision, Recall and F1 Scores. Fortunately these measures are easily accessible in Python via Scikit Learn.
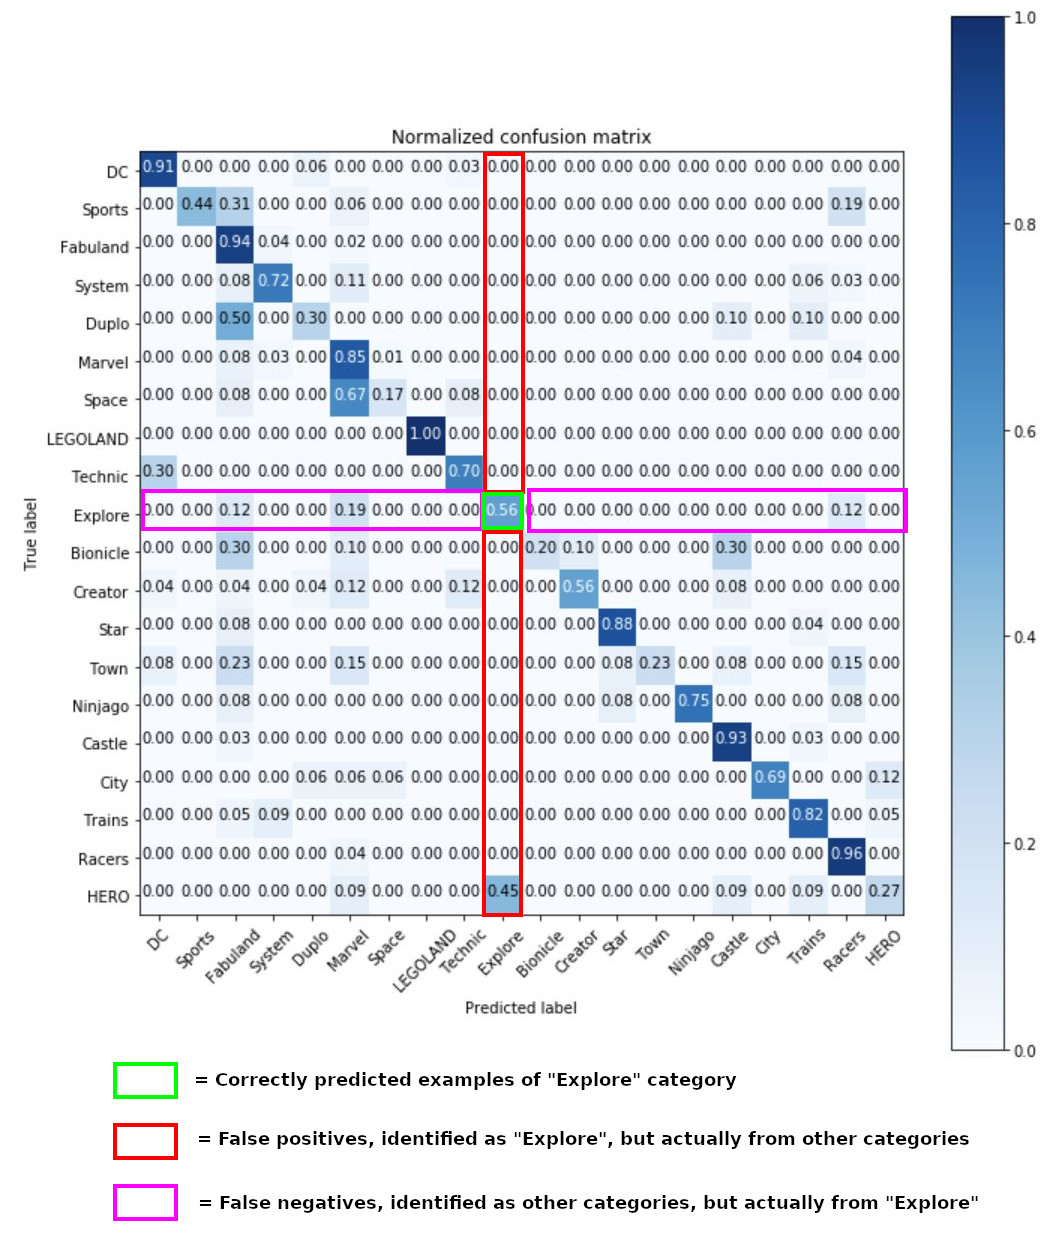
The confusion matrix is a way of looking at your model’s performance in a visual way. It is a square plot which plots test cases’ true class on one axis, and the predicted class on the other. Cases falling on the main diagonal have been correctly predicted. Other cases were incorrectly predicted. Generally row labels are the ground truth and column labels are the predicted classes.
Reading across a given row of a confusion matrix you can see which items of a class were mispredicted as being in a different class – false negatives. Reading down a column you can see where the model mispredicted items from other classes to be part of the predicted class – false positives. This information lets you see which particular classes the model is having difficulty distinguishing, it may indicate that the classes are genuinely more difficult to separate than the other classes. These classes may require more training data or a tweak to hyper-parameters to separate.
The errors in the model can also be represented mathematically as precision and recall. If you are not already familiar, precision looks at the rate of false positives and recall looks at the rate of false negatives. They are frequently used in binary classification where their formulae are as follows:


The same basic formulae apply in a multiclass case, but in this case the false negatives or false positives are added across all the classes other than the one providing the true positives. That is you sum the relevant row or column of the confusion matrix excluding the term on the diagonal. To put this in more mathematical terms


The F1 Score is the harmonic mean of the recall and precision. It is calculated as follows

Note that as it is a harmonic mean, the F1 score will tend to reflect the worse of the two scores out of precision and recall, this is useful as generally we want a model which produces few errors of either kind.
The numeric version of the confusion matrix and the precision, recall and F1 scores can be obtained by passing the validation or test set predictions and the true labels to Scikit Learn’s confusion_matrix and classification_report functions.
def prediction3 (validation_generator_local, class_dictionary, num_of_test_samples, model_1, model_2):

    # produce a list of the labels
    target_names = list(class_dictionary.keys())

    # get the bottleneck prediction from the pre-trained VGG16 model
    bottleneck_gen_prediction = model_1.predict_generator(validation_generator_local, num_of_test_samples // batch_size+1)

    # use the bottleneck prediction on the top model to get the final classification
    Y_pred = model_2.predict_classes(bottleneck_gen_prediction, num_of_test_samples // batch_size+1)

    print (" ")
    print('Confusion Matrix')
    print(confusion_matrix(validation_generator.classes, Y_pred))

    print (" ")
    print('Classification Report')
    print(classification_report(validation_generator.classes, Y_pred, target_names=target_names))

    cnf_matrix = confusion_matrix(validation_generator.classes, Y_pred)
    np.set_printoptions(precision=2)

    # Plot normalized confusion matrix
    plt.figure()
    plot_confusion_matrix(cnf_matrix, classes=target_names, normalize=True,
                        title='Normalized confusion matrix')
    plt.show()
    return
from sklearn.metrics import classification_report, confusion_matrix
import itertools

# load and calculate our constant variables
class_dictionary = np.load('class_indices.npy').item()
num_classes = len(class_dictionary)
model_1, model_2 = build_model2(class_dictionary, num_classes)
num_samples = len(test_image_paths)

# create validation generators for confusion matrix code
#remember scaling factor
datagen_valid = ImageDataGenerator(rescale=1. / 255)

# create a generator for the validation images to see where we are getting issues
validation_generator = datagen_valid.flow_from_directory(
        validation_data_dir,
        target_size=(img_width, img_height),
        batch_size=batch_size,
        class_mode=None,
        shuffle=False)

prediction3 (validation_generator, class_dictionary, num_samples, model_1, model_2)
This gives us the following output
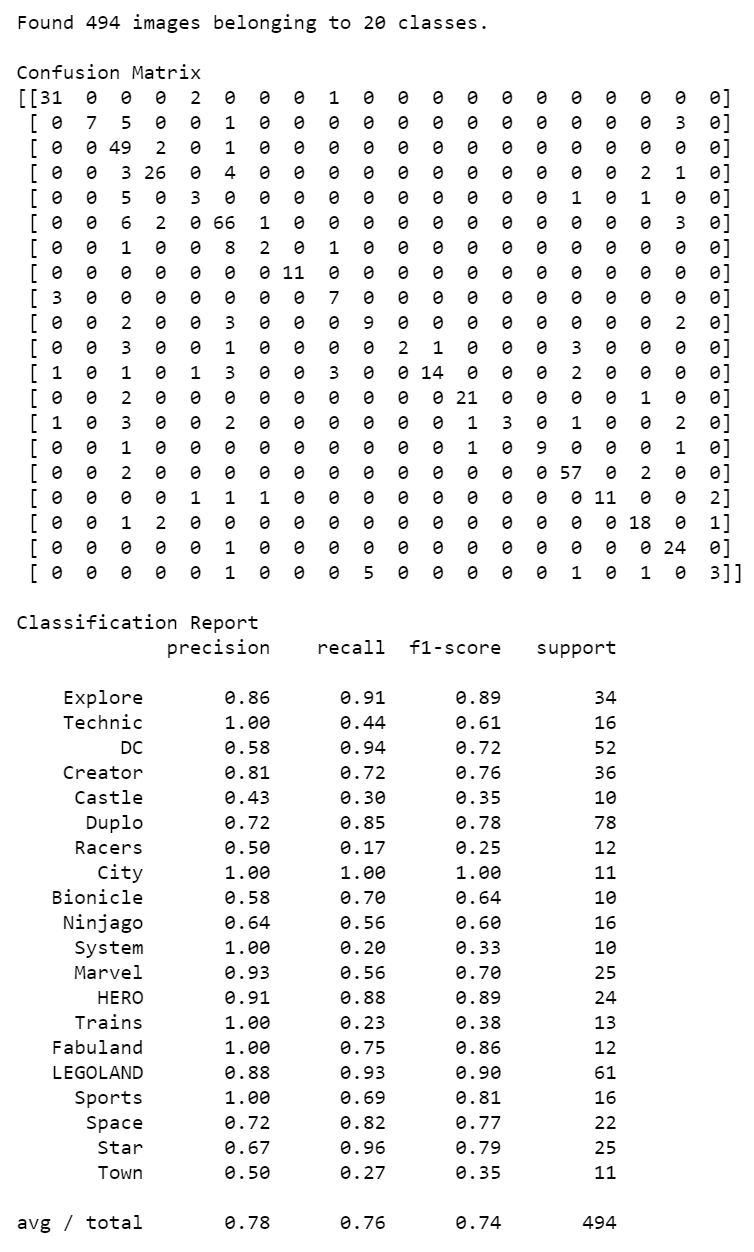
Note that we also get averages of the scores on the classification report.
We can also feed the data into a shaded heatmap version of the confusion matrix using Mathplotlib
def plot_confusion_matrix(cm, classes, normalize=False, title='Confusion matrix', cmap=plt.cm.Blues):

if normalize:
cm = cm.astype('float') / cm.sum(axis=1)[:, np.newaxis]
print("Normalized confusion matrix")
else:
print('Confusion matrix, without normalization')

plt.imshow(cm, interpolation='nearest', cmap=cmap)
plt.title(title)
plt.colorbar()
tick_marks = np.arange(len(classes))
plt.xticks(tick_marks, classes, rotation=45)
plt.yticks(tick_marks, classes)

fmt = '.2f' if normalize else 'd'
thresh = cm.max() / 2.

plt.tight_layout()
plt.ylabel('True label')
plt.xlabel('Predicted label')
This gives us the following visual plot.
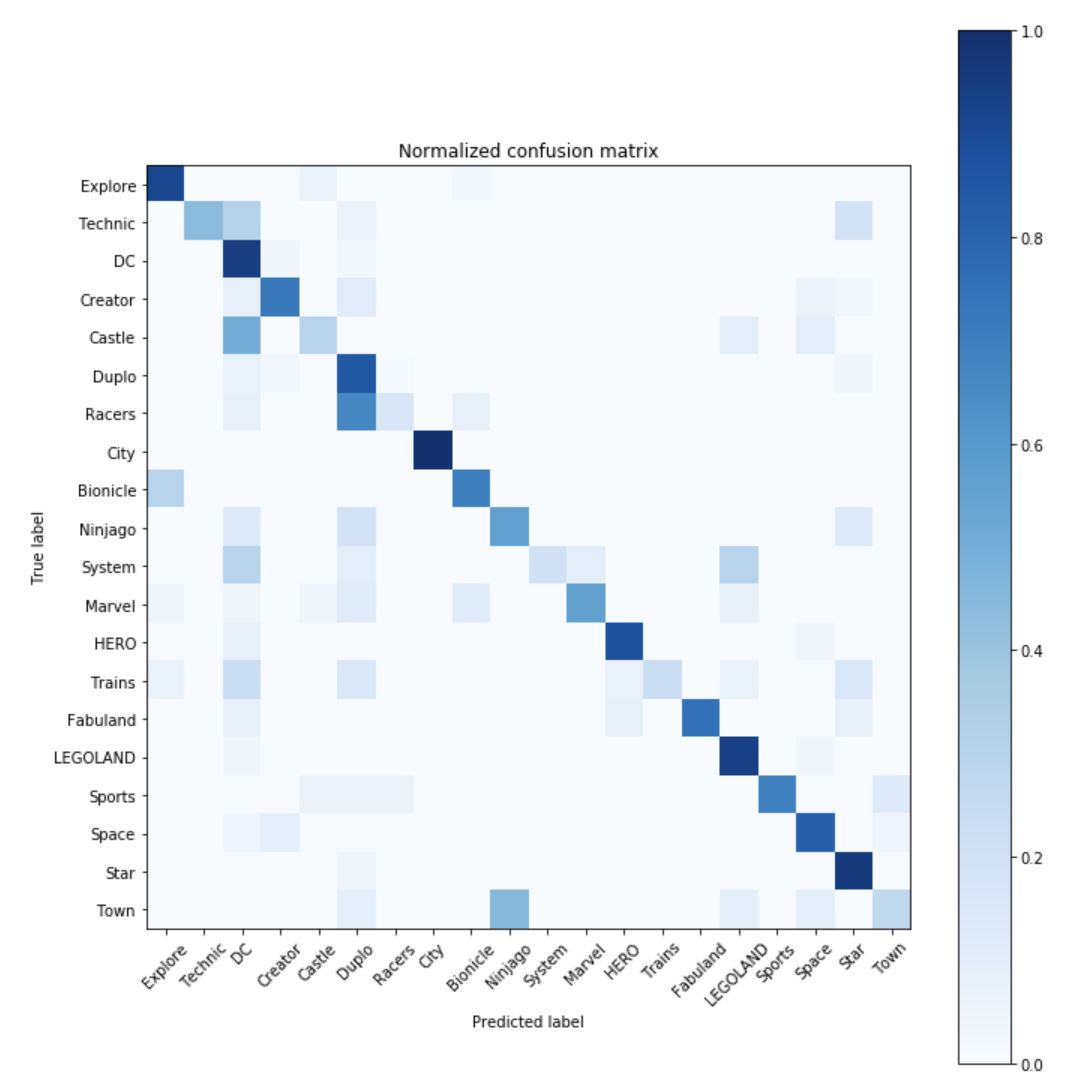
From this information we can clearly see which categories are causing our model the most difficulty. For example we can see that the “System” category has poor recall of 0.20 (lots of errors on the horizontal axis) even though its precision is 1.00. Meanwhile while “DC” is having issues with a precision of 0.58 (lots of errors on the vertical axis) though its recall is 0.94.