Using time efficiently is important in a lot of fields. This can be at a personal level to get more done, or to have more free time. It can also be vital at an organisational level to ensure that resources are used efficiently and that time is not wasted.
The requirements here can be diverse. You might want to know how you are currently using your time. You might want to think about how you would prefer to use your time. Also youmight want to compare time use between coworkers, or to compare leadership’s vision of how time should be used in the company with what is actually going on. The good news is that there is a simple tool to assist. The pie chart.
The pie chart is a great tool here because most people are familiar with it. It is intuitive to read and easy to draw. Lets look at some ways it can be used.
Assessing people’s beliefs about the current situation
The first and most obvious way to use a pie chart is to assess the current situation. Get people with direct knowledge of how time is spent to create a pie chart of how their time is divided between different activities. Generally you should allow people to decide on their own divisions of time to start with. This prevents you missing an activitybecause it was not on the activities list. Once the initial chart is drawn it can be useful to ask people to further subdivide the larger slices of the pie into more granular sections. Also catchall “other tasks” slices may need some drill down to find out what tasks are covered.
How do others believe time is being used
A useful addition to this activity can be to have co-workers and managers also pie chart how they believe each person in their team spends their time. This should be done independently without cross referencing in the first instance. This can lead to interesting discoveries about how different members of the team believe time is being used. You can also get team members performing the same role to chart their time independently to identify similarities and differences. Note that you do need quite a high trust team environment for this to work effectively.
Comparing belief to reality
Sometimes it is sufficient for you to ask people how they believe their time is being used. In general people have a reasonable idea of how they spend their time. Thus you can easily identify some areas for more or less time investment direct from the initial pie charts. However it can also be useful to see whether time is really being spent as people believe. People tend to underestimate how long is spent on unproductive tasks. A spreadsheet, paper based time log, or a tool like toggl can be used to track time usage for a few weeks to get a more objective view of how time is being used. The key thing here is to ensure that the time logging is simple to do. Time logging which is unduly complex or requires people to break their focus on other tasks will likely not be completed accurately.
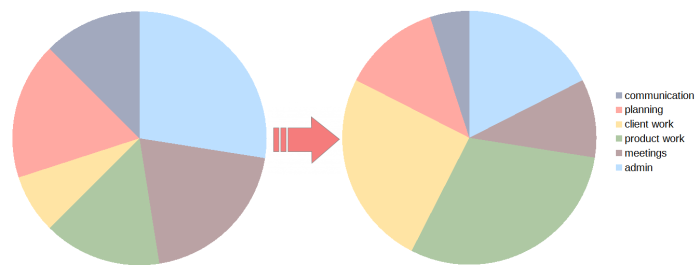
Setting future goals
The next useful thing to do with time usage pie charts is to draw up charts of how people believe their time should be divided between tasks. Once again this can be done by both the person seeking to improve their time management and their coworkers and manager. These charts of desired time allocation will give an indication of where time investment needs to be trimmed from tasks and where it needs to be added. It can also highlight tensions in how different parts of a team believe time should be spent. This allows for negotiation on the best use of time. Completing this exercise makes it a lot easier to plan what concrete actions are needed in order to reallocate time to higher priority tasks.
Planning how time should be moved about can also can benefit from the usage of the Urgent-Important Window technique (sometimes known as the Eisenhower Matrix). This ensures that important tasks do not get dropped when reorganising how time is spent. It can also indicate where time can ssafely be reclaimed from trivial tasks.
Monitoring whether changes have been successful
Once the plan is set you can draw up the the future time allocation plans as pie charts and then periodically review against estimated or logged time usage. This should ensure that any plans for change are actually being implemented successfully. Such pie charts can also be drawn up at the team level by simply summing the pie charts of the team members. This can help avoid situations where individuals time allocations do not accord with those needed by the team as a whole.
Improving organisational alignment
The other great thing about these pie charts is that they make it easy to check that organisational priorities are aligned and that sufficient time has been allocated across an organisation for key tasks.
The key questions to ask here include
- Do managers, workers and their co-workers agree on the current time allocation?
- Does time logging suggest that people have an accurate idea of how they are spending their time?
- Do people agree on how time should be spent in future?
- Do the total amounts of time allocated to individuals for given tasks accord with team and organisation wide expected time allocations?
- Is there a sufficient total time budget for everything to be accomplished?
If the answers to all these questions are yes, then it is likely that you will have a harmoniously working organisation and engaged productive people. If the answer to any of them are no then the various pie charts give you a good indication of where problems lie and may also give pointer on possible solutions